

Since the ongoing âToolShellâ exploitation campaign, in which threat actors attack on-premise Sharpoint servers using a chain of two recently published vulnerabilities[1,2,3], is still on top of the cyber security news[4,5,6,7], I thought it might be a good time to look at the question of how quickly do we â as a global society â actually patch actively-exploited vulnerabilities when it comes to our internet-facing systems.
Since the ongoing “ToolShell” exploitation campaign, in which threat actors attack on-premise Sharpoint servers using a chain of two recently published vulnerabilities[1,2,3], is still on top of the cyber security news[4,5,6,7], I thought it might be a good time to look at the question of how quickly do we – as a global society – actually patch actively-exploited vulnerabilities when it comes to our internet-facing systems.
While this is admittedly a very complex topic, and in order to arrive at any detailed conclusions, an in-depth, long-term study would be needed, I believe that even a quick look at available data may show us some general (and hopefully interesting) trends.
Since I – on my own – lack the ability to periodically scan the entire internet and identify how many systems are affected and/or patched when it comes to specific vulnerability, I decided to use data gathered from Shodan using my TriOp tool[8] over the past 30 months. Specifically, I looked at the number of systems that Shodan detected as “vulnerable” to any vulnerability listed in the CISA KEV catalog[9] each day during that timeframe.
It should be mentioned at this point that Shodan is not capable of detecting all of the KEV vulnerabilities (of the approximately 1380 vulnerabilities currently listed in the KEV, it seems to be able to identify only between 200 and 250) and that even for those vulnerabilities it detects, the mechanisms it uses to identify whether a specific system is vulnerable are passive in nature. Therefore, the resulting numbers are – by necessity – not exact, since there is a significant potential for false-positive (or false-negative) identification. Nevertheless, this data still provides a good starting point.
From all the data, I removed CVEs for which Shodan detected less than 50 vulnerable systems (or – to be more exact – 50 public IP addresses) and then generated time charts for all of the rest.
Based on a quick visual analysis, it appears that (if we gloss over the sharp sudden decreases/increases that Shodan is prone to – see e.g. [10] – and omit other Shodan-introduced artifacts, such as sharp increases in detections most likely associated with new detection analytics) for most vulnerabilities, the number of affected systems decreases over time in more or less linear fashion, with a tendency to slowly level out… As you may see below, in some cases, the rate of decrease is slower than in others, which may be due to slower patching or due to Shodan (at least partially) not being able to recognize backported patches.
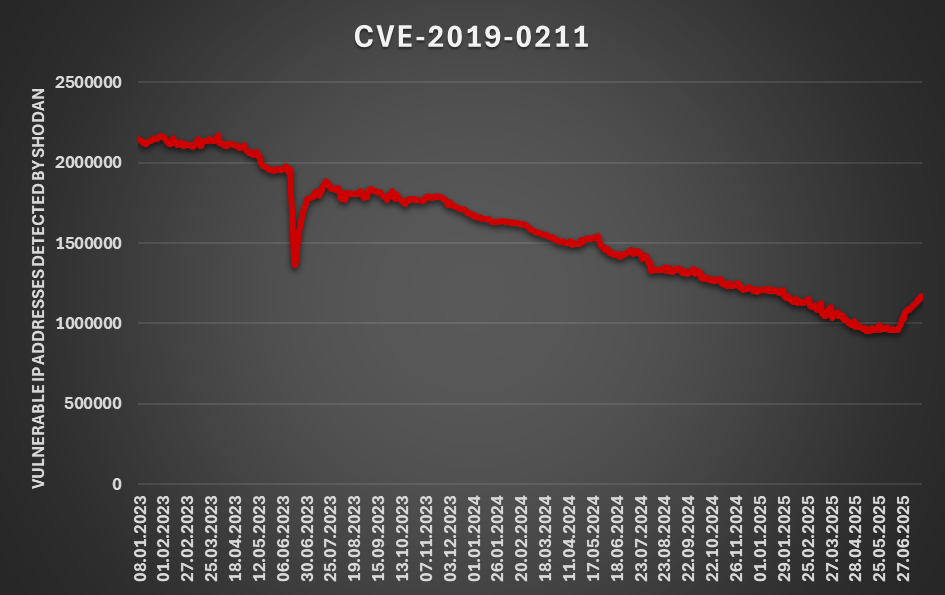
Data for CVE-2019-0211
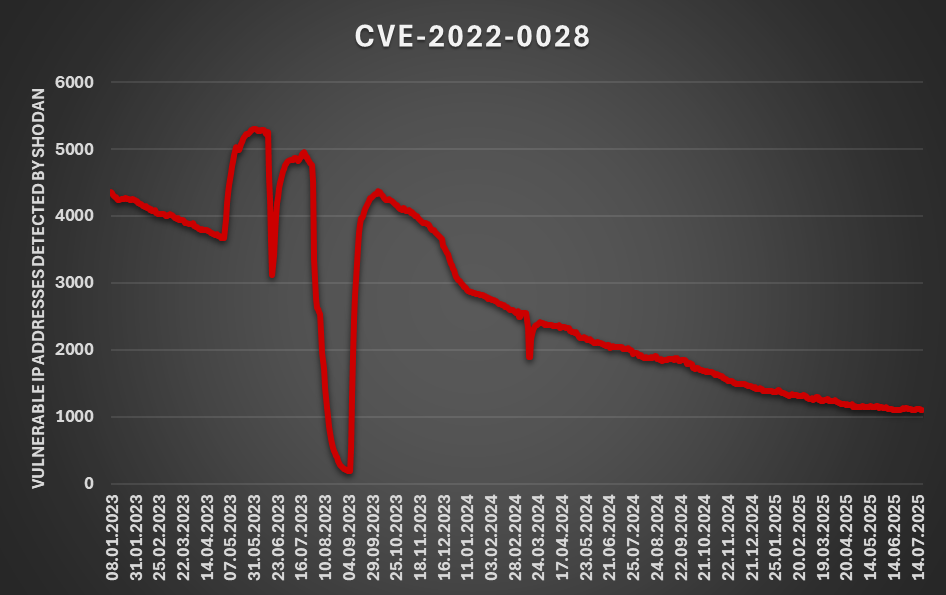
Data for CVE-2022-0028
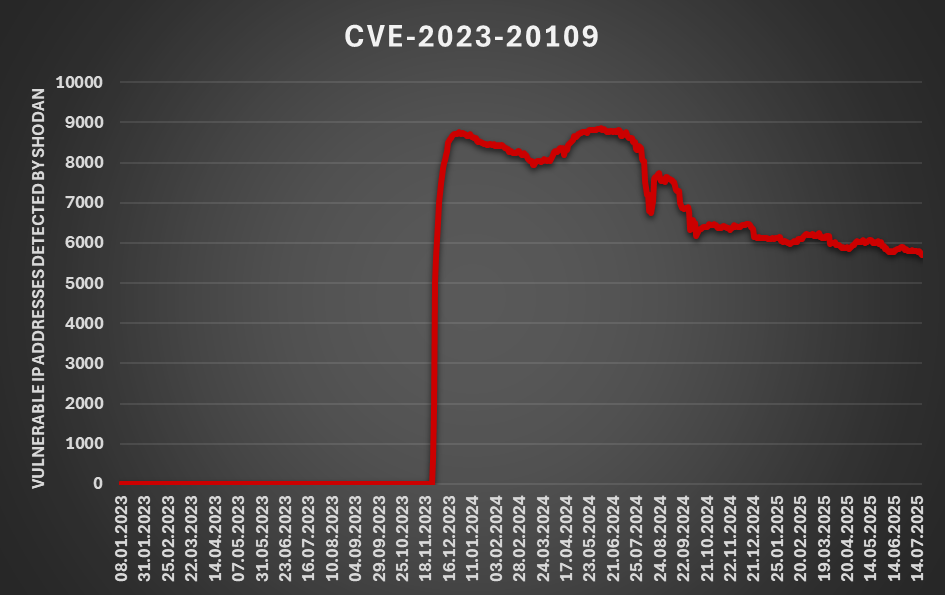
Data for CVE-2023-20109
Although for some vulnerabilities, there were occasions when a sharper short-term decrease was visible in the number of vulnerable systems, these were always explainable not by increased patching but by removal of systems that reached their “end of life” from production environments.
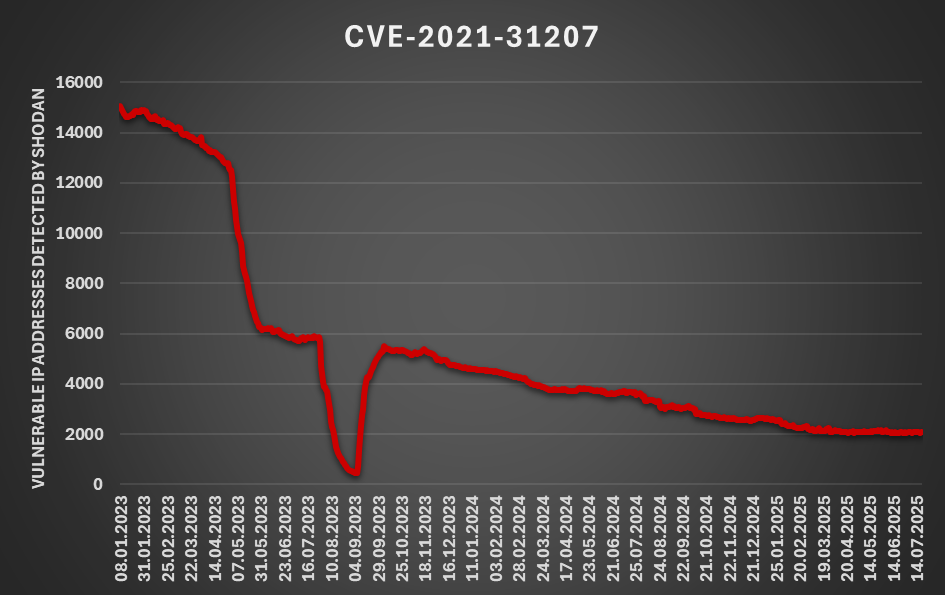
This effect can be clearly seen in chart for an Exchange vulnerability CVE-2021-31207 (and in charts for two other Exchange vulnerabilities – CVE-2021-34523 and CVE-2021-34473), where we may observe a significant decrease of vulnerable IP addresses detected by Shodan starting at the end of April 2023 and ending in the early May 2023. This decrease is almost certainly related to the fact that Microsoft ended support for Exchange 2013 (which was affected by the vulnerability/vulnerabilities) on April 11, 2023[11].
Data for CVE-2021-31207
To sum up, although we need to take the Shodan numbers with a grain of salt, and although vulnerabilities in CISA KEV may not necessarily be the most important ones from everyone’s perspective, from what we’ve shown, it seems that even in July of 2025, the answer to the question of “How quickly do we patch?” is still “Not nearly quickly enough!”.
And while we’ve historically seen cases of vulnerabilities, where patching was relatively fast and the remaining “vulnerable population” was nearly insignificant (such as CVE-2019-19781 AKA “Shitrix”)[12], these – sadly – still seem to be the exception, rather than the rule…
[1] https://msrc.microsoft.com/blog/2025/07/customer-guidance-for-sharepoint-vulnerability-cve-2025-53770/
[2] https://www.cisa.gov/news-events/alerts/2025/07/20/microsoft-releases-guidance-exploitation-sharepoint-vulnerability-cve-2025-53770
[3] https://research.eye.security/sharepoint-under-siege/
[4] https://www.bleepingcomputer.com/news/microsoft/microsoft-sharepoint-zero-day-exploited-in-rce-attacks-no-patch-available/
[5] https://thehackernews.com/2025/07/critical-microsoft-sharepoint-flaw.html
[6] https://www.securityweek.com/sharepoint-under-attack-microsoft-warns-of-zero-day-exploited-in-the-wild-no-patch-available/
[7] https://www.helpnetsecurity.com/2025/07/20/microsoft-sharepoint-servers-under-attack-via-zero-day-vulnerability-with-no-patch-cve-2025-53770/
[8] https://isc.sans.edu/diary/27034
[9] https://www.cisa.gov/known-exploited-vulnerabilities-catalog
[10] https://isc.sans.edu/diary/SSL+20+turns+30+this+Sunday+Perhaps+the+time+has+come+to+let+it+die/31664
[11] https://learn.microsoft.com/en-us/troubleshoot/exchange/administration/exchange-2013-end-of-support
[12] https://isc.sans.edu/diary/26900
———–
Jan Kopriva
LinkedIn
Nettles Consulting
(c) SANS Internet Storm Center. https://isc.sans.edu Creative Commons Attribution-Noncommercial 3.0 United States License.
Leave A Reply